Showing posts with label bonds. Show all posts

Thursday, September 22, 2022

Less Negative is Positive

"A negative times a negative equals a positive."
--Jaime Escalante (Stand and Deliver)

Negative interest rate policies (NIRP) enacted by central banks across the globe in the middle of last decade spawned a mountain of negative interest-bearing debt. It was hard to imagine who was buying it although, in reality, central banks themselves were hoovering much of it up as part of their quantitative easing (QE) programs.

The worm has turned dramatically as inflation has picked up and CBs are now raising rates. After hitting a peak of about $17 trillion in 2020, negative yielding debt has plummeted to less than $2 trillion. Most of that decline has come since the beginning of 2022.

As NIRP debt declines, it seems likely that broken conventional discounting processes get repaired.

Central banks become extra big losers as NIRP reverses. They bought $trillions of negative yielding bonds that have now been pounded as rates rise and bond prices fall. Many CBs are approaching the broke point on paper.

While these institutions can simply print more money out of thin air to rectify their upside down balance sheets, this would create quite the paradox of creating more money in an inflationary environment.

Wednesday, September 21, 2022

TINA Turning?

All I want is a little reaction
Just enough to tip the scales

--Tina Turner

During the era of interest rate suppression, people turned to stocks, particularly dividend payers, because it seemed there was no alterative (TINA). With yields presently moving higher, the TINA attitude should dissipate as investors switch out of stock in favor of the relative safety of high yielding bonds.

Today the 2 yr Treasury yields touched 4%. This more than 2x the S&P 500 dividend yield.

The higher this spread goes, the more pressure we should see on stocks as investors flock to 'risk-free' cash yields.

Wednesday, September 14, 2022

See the Signs

Life is demanding
Without understanding

--Ace of Base

Article lays out five signs of recession currently flashing red:

1) Declining monetary base. As quantitative tightening proceeds, money supply should drop even more.

2) Inverted yield curve. Inverted yield curves are leading indicators of economic problems, and have preceded every recession for decades.

3) Tighter lending standards. Economic slowdowns increase risk aversion. Banks tighten credit standards to avoid losses during recessions. We're approaching tightness associated with past recessions.

4) Falling housing market prices. Mortgage rates have more than doubled over the past year. As prices and borrowing costs go up, demand for houses has gone down. Inventory is now above 10 months of supply--a threshold that has consistently been associated with past recessions.

5) Declining manufacturing and trade sales. Sales are down over one percent YOY. Declines below zero have coincided with every recession since the 1970s.

These indicators suggest that a recession is not imminent. Rather, it is likely already here.

Sunday, September 4, 2022

Repos and QT

Then the door was opened
And the wind appeared
The candles blew
And then disappered

--Blue Oyster Cult

Interesting WSJ article suggesting that declining reserves stemming from the Fed's 'quantitative tightening' (QT) program poses a significant threat to financial markets. 

QT is the reverse of quantitative easing (QE). In QE, the Fed printed money out of thin air to buy bonds from banks. That printed money became 'reserves' that the banks have deposited with the Fed. Unsurprisingly, reserves have rocketed higher given the $9 trillion of bonds that the Fed now holds on its balance sheet via QE. 

Bank reserves serve various purposes. They can be used to settle trades with other banks. Reserves are also kept to satisfy regulatory requirements, which have generally been ratcheted higher since 2008, to provide some margin of safety in the event of another systemic credit event.

Reserves can also be used for investment purposes. One popular avenue toward this end is the repo market. Repos are contracts where one party sells securities to another party in exchange for cash. The buyer (who is engaging in what is called a 'reverse repo) promises to sell the securities back to the original holder at some future (usually near term) date and at a set (usually higher) price.

These pseudo loans help the pseudo borrowers manage short term cash obligations while providing the reverse repo pseudo lenders with quick profits.

When reserve levels are high then the 'interest rates' governing repos are low and usually in line with the Fed Funds Rate. However, when reserves decline, repo rates are prone to rise because there is less capacity for reverse repo 'lenders' to employ. 

As the Fed embarks on QT, reserves are beginning to fall. Although there are no signs yet of stress in the repo markets, there is belief that it is only a matter of time before problems surface. 

Indeed, in 2019, the Fed had to inject emergency shots of liquidity into these markets after previous QT programs resulted in skyrocketing repo rates that threatened to seize up money markets.

Given the size and centrality of money markets to contemporary market functioning, it may once again be time to fear the repo.

Thursday, September 1, 2022

Cause for Pause

How can you just leave me standing
Along in a world that's so cold?

--Prince

Our working hypothesis is that the Fed will pivot from its hawkish track when 'something breaks' in the market. That's been the historical pattern and there's no reason to believe this time will be any different.

But where will the breakage occur this time around? One possibility is something in the credit markets. The greater the systemic leverage, the more susceptible the system is to higher interest rates. And systemic leverage has never been higher.

After the Fed's historic tightening over the past six months (on a relative basis), some folks are on the lookout for cracks in credit. We recently noted, for example, that low rated debt spreads are widening toward alarm levels.

Another possibility, one stressed here, is that a funding crisis arises in Washington. Higher rates mean more interest expense on ever-escalating federal debt levels. We're currently on a run rate to spend over $1 annually on Treasury bond interest. How much longer before politicians exert enough pressure on the Fed before it breaks?

Finally, one possibility that I frankly had not entertained concerns the strong dollar. The dollar index (DXY) currently stands at its highest level since 2002. The broader Bloomberg dollar index has spiked above the pandemic highs.

There is growing suspicion that this is sparking margin calls in emerging markets stemming from short dollar positions. 

If so, then systemic contagion could provide another possible cause for Fed pause.

Thursday, July 21, 2022

Zero Coherence

Maybe someday
Saved by zero
I'll be more together

--The Fixx

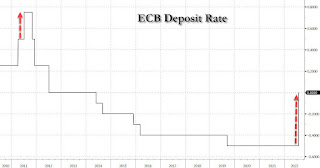
Earlier today the European Central Bank (ECB) raised its deposit rate 50 basis point to...zero. The ECB's deposit rate had been in negative territory since 2014, meaning that depositors essentially paid to keep their money in the central bank's vault.

This is also the first interest rate increase by the ECB since 2011.

Needless to say, monetary policy in Europe has been off the rails for quite some time.

To demonstrate that it hasn't suddenly been transformed into an institution with coherence, the ECB unleashed a blizzard of acronym-heavy programs, such as Transmissions Protection Mechanisms (TPI), designed to selectively buy bonds of struggling EU countries (e.g., Italy) to keep sovereign debt from imploding.

Thus, we have a central bank raising interest rates while continuing easy money policy using a quantitative easing (QE) transmission mechanism.

The ECB truly makes the Fed look smart.

Tuesday, June 7, 2022

Much Higher

I have a picture
Pinned to my wall
An image of you and of me
And we're laughing
We're loving it all

--Thompson Twins

Yesterday 10 yr Treasury yields closed back above 3%. As long duration yields rise, I've been pondering just how high they would need to be before I was a serious bond buyer.

My answer is, "Much higher."

For me, fixed income competes with dividend-paying stocks. Currently I can put together a portfolio of dividend paying stocks that pays a 3% or more in cash annually. 

Plus, those dividend yields are likely to increase over time. If yields increased 5% annually (not far from historical averages for many dividend payers), then a stock that pays $5/share annually in dividends this year will be paying more than $8/share ten years from now. 

There is also the potential for share price appreciation. These features are especially attractive to hedge against inflationary pressures like we have now.

Bonds simply do not offer the same risk/reward profile--at least at current levels.

Where would 10 yr Treasury yields need to be for me to consider them? Maybe 10% or more to compensate for the risks and opportunity costs of foregoing dividend-paying stocks.

It should be noted that these levels would approximate T-notes yields in the early 80s when the last bond bull market began.

Thursday, June 2, 2022

Not Wide Enough

Sam Rogers: It's gonna get worse before it gets better.
Will Emerson: Ya think?
Sam Rogers: Much.

--Margin Call

One indicator that we're not at 'defcon' market levels is credit spreads. While spreads on junk bonds on rising, they're not at the wides associated with previous crises.

Due to its centrality to modern finance, we likely need to see more stress in the credit domain before 'the' bottom is in...

Wednesday, May 18, 2022

More Extremes

Dr Melissa Reeves: Why do you call Billy 'The Extreme?'
Dustin 'Dusty' Davis: Because Bill IS 'The Extreme!'

--Twister

More data points suggest that we're approaching noteworthy market extremes. Bank of America's (BAC) fund manager survey is touching crisis-level sentiment in both expectations for economic growth...

...and for profit growth.

On a separate front, credit default swaps on investment grade (IG) debt widening--approaching levels that have historically caused the Fed to pivot away from program intended to tighten monetary conditions.

I continue to sense that, although the Fed is talking tough, it will act far more dovishly than currently expected.

position in BAC

Tuesday, May 3, 2022

Three Peat

When my back is broken
When the mountain moves away
All the dreams and promises
That we give
We give away

--INXS

Ten yr yield touched 3% yesterday. Not terribly high by long term historical standards but noteworthy given recent context. Last time at 3% coincided with Fed chair Powell folding like a cheap suit and reversing the Fed's tightening policies in 2018.

The above chart shows the relative field position then vs now. Last time, the Fed had already raised rates several times by the time 10 yr yields touched a 3 handle. This time, we're at 3% after only one measly 25 bip increase.

More fuel for the argument that the current tightening campaign will cease far sooner than currently forecast.

Tuesday, April 26, 2022

Losing Control

Tyson: The way this merger's worked out, I have all the titles and you have all the control.
Linus Larabee: I always make it a point to have control.
--Sabrina

Common wisdom is that bond yields are up because of the Fed's anticipated actions. But what if yields are up despite the Fed's anticipated actions.

If the latter is true, then perhaps the Fed is losing control of the bond market.

Saturday, April 23, 2022

Falling FAANG Forecast

I see the bad moon rising
I see trouble on the way
I see earthquakes and lightning
I see bad times today

--Creedence Clearwater Rivival

Couple of interesting charts. First (Chart 3) presents a ratio of resource vs biotech ETFs alongside the yield on the German 5 yr bund since 2010. The relationship is readily apparent. Lower yields favor biotech ETFs (a proxy for speculative risk taking in 'tech') relative to price of resource ETFs (a proxy for inflation and conservative positioning in 'stuff' stocks). 

Now, as rates climb higher, the ratio is moving in favor of resource ETFs. Note that the ratio has lots of room to move higher, as suggested by the previous peak in 2010-2011.

The second chart plots central bank liquidity (presumably the aggregate assets on central bank balance sheets mostly due to asset buying programs associated with quantitative easing) alongside the market cap of the FAANG+ group which, due to their immense size can be seen as proxies for the overall market--particularly the tech side. This can be seen a slightly different take on this important chart.

The relationship could not be more obvious. The trillion$ of money printed out of thin air to fund central banks asset purchases has goosed stock prices higher.

With central banks now signaling a reversal of QE programs as they address surging prices of goods and services, the ramifications of doing so are ominous for stocks--particularly those of the speculative FAANG variety.

Sunday, April 3, 2022

Inverted Yield Curves

Upside down
Boy, you turn me
Inside out
And round and round

--Diana Ross

This past week the yield on two-year Treasuries exceeded the yield on ten-year Treasuries. This is unusual. Normally investors demand higher interest rates on longer dated debt. When the yield relationship flips over, or 'inverts,' it often seen as a harbinger of forthcoming economic recession.

Indeed, a review of past occurrences of inversions between 'twos and tens' suggests a good predictive track record. Even if the relationship subsequently 'un-inverts' (which it often does), recession appears imminent.

However, it should be noted that many maturities comprise the complete Treasury yield curve--beginning with 1-3 month T-bills all the way out to 30 yr Treasury bonds. Currently, only the twos and tens relationship is upside down. 

For example, the spread between 12 month and 10 year Treasuries has yet to invert. Yet, note that the 12 month/10 yr relationship has also been a good predictor of recession.

What this suggests is that the relationship between twos and tens, and subsequent recession may be a spurious one when viewed in isolation. The recessionary signal sent by the inversion phenomenon is likely stronger when more of the yield curve joins in. 

Consequently, look for shorter duration yields to continue rising relative to long duration yields before confidently concluding that the inverted yield curve/recession warning is in play.

Monday, March 14, 2022

Monetary Cease Fire

It's 2 am, the fear is gone
I'm still sitting here, the gun still warm
Maybe my connection is tired of taking chances

--Golden Earring

Last week the Fed made a final bond purchase before shutting down its fourth round of QE operations. 

During the most recent round of QE, which was instigated during the CV19 panic, the Fed has added an additional $5 trillion to its balance sheet--on top of the roughly $4 trillion from the previous QE junkets.

As shown above, QE programs by the Fed and other central banks around the world have lit a fire under asset prices. Any attempt to unwind QE balance sheet assets has led to lower prices.

This begs questions about the durability of this monetary cease fire. What will the Fed do with those $trillions on its balance sheet? And how long will it be until QE5 fires up?

Sunday, February 20, 2022

Spreading Out

We
So tired of all the darkness in our lives
With no more angry words to say can come alive
Get into a car and drive
To the other side
--Joe Jackson

Spread between high yield bonds and stocks has been widening.

But classic 'credit spreads,' i.e., difference between 'risk free' Treasury rates and bond rates, are in early stages of widening.

Interpretation: spreads have a ways to go before reaching 'blow out' levels. But they bear watching.

Friday, February 11, 2022

Still Printing

I fear I'll do some damage
One fine day
But I would not be convicted
By a jury of my peers
Still crazy after all these years
--Paul Simon

This article raises an excellent question. With inflation soaring, why does the Fed continue in Quantitative easing?

Stated differently, how does printing money to buy assets do anything but add to the inflation problem? Indeed, classically defined, inflation is money printing.

The answer seems obvious.

Postscript: The Fed just released its POMO schedule for the next 4 weeks.

It plans at least another month of QE-related money printing and asset buying.

Tuesday, February 8, 2022

Dividends Bid

So much for your promises
They died the day you let me go
Caught up in a web of lies
But it was just too late to know

--Johnny Hates Jazz

Rising interest rates should put pressure on dividend paying stocks, as market participants swap out of riskier equities for fixed income streams perceived as more secure. So far, however, it hasn't been working out this way from where I sit. In fact, quite the opposite.

Most dividend-paying stocks that I follow have been catching bids and are at/near their highs.

One possible explanation is that higher rates are causing many fund managers to sell bonds in order to manage risk (bond prices decline as rates rise). To recoup some of the lost cash stream, perhaps some managers are plowing the proceeds into dividend-paying stocks.

Far fetched? Maybe, as one would think higher coupons of new bond issues would entice the opposite trade: sell stocks in favor of higher yielding bonds. 

But am have trouble coming up with plausible rival theories that explains the current bid underneath dividend payers given the current field position and macro backdrop.

Monday, February 7, 2022

Yield Signs

When it gets too much
I need to feel your touch

--Bryan Adams

Ten year Treasury yields are now north of 1.9%. While not high by historical standards, T-note yields are beginning to challenge stock dividend yields. The yield on the S&P 500 is only about 1.3%.

Higher bond yields will slowly pry income-seeking investors away from stocks.

One more thing for the Fed to worry about...

Wednesday, February 2, 2022

Debt Parabola

Well, it's a marvelous night for a moon dance
With the stars up above in your eyes

--Van Morrison

Federal debt has crossed $30 trillion. Prior to 2008, the trend was bad enough.

Since then, the trend line slope has essentially doubled.

A new segment for our debt parabola.

Wednesday, January 26, 2022

Every Time

Every time I think of you
It always turns out good
Every time I've held you
I thought you understood

--The Babys

Peter Schiff is correct. Despite some hawkish rhetoric, the Fed can't raise rates significantly nor unwind its QE assets. Doing so would surely collapse the overleveraged, hyper financialized system.

This is, of course, an untenable outcome. 

After decades of recklessness, the Fed appears to have finally painted itself into the inevitable corner. Trillion$ of easy money and credit created to goose asset markets is now spilling into the mainstream economy, jacking prices of goods and services higher.

Fed heads face a decision. Tighten monetary policy to tame inflation but tank financial markets. Or let inflation ride.

When push comes to shove (and it will), the Fed will choose door number two every time.