Showing posts with label deflation. Show all posts

Wednesday, September 14, 2022

See the Signs

Life is demanding
Without understanding

--Ace of Base

Article lays out five signs of recession currently flashing red:

1) Declining monetary base. As quantitative tightening proceeds, money supply should drop even more.

2) Inverted yield curve. Inverted yield curves are leading indicators of economic problems, and have preceded every recession for decades.

3) Tighter lending standards. Economic slowdowns increase risk aversion. Banks tighten credit standards to avoid losses during recessions. We're approaching tightness associated with past recessions.

4) Falling housing market prices. Mortgage rates have more than doubled over the past year. As prices and borrowing costs go up, demand for houses has gone down. Inventory is now above 10 months of supply--a threshold that has consistently been associated with past recessions.

5) Declining manufacturing and trade sales. Sales are down over one percent YOY. Declines below zero have coincided with every recession since the 1970s.

These indicators suggest that a recession is not imminent. Rather, it is likely already here.

Saturday, January 15, 2022

Important Chart

There's a room where the lights won't find you
Holding hands while the walls come tumbling down
When they do, I'll be right behind you

--Tears for Fears

Have been looking for an updated version of this chart for a while. Finally found one courtesy of maven Stephanie Pomboy.

The chart continues to tell an important, if not THE, story behind the huge rise in stock prices (as well as other asset prices) since the 2008 credit crisis.

The graph plots balance sheet assets of the Federal Reserve alongside the S&P 500 Index (SPX) from 2009 thru the end of 2021. The correlation between the two series is unmistakable. Increases in the Fed's balance sheet, which has more than quadrupled in size since 2009, correspond to increases in overall stock prices.

What has caused the Fed's balance sheet to increase so dramatically? The primary driver has become known as 'quantitative easing' (QE)--a program designed to, among other things, stimulate economic activity after major calamities such as the 2008 credit collapse. 

When conducting QE operations, the Fed purchases securities (mostly Treasury and agency bonds) from financial institutions that deal in those securities. For instance, the Fed might observe $100 million in Treasuries sitting in J.P. Morgan's (JPM) inventory, and then buy them all by placing a credit of $100 million with JPM in exchange for the bonds. The $100 million in Treasuries is added to the Fed's balance sheet.

Where does the Fed get the $100 million to buy those bonds from JPM? Out of thin air, baby. It creates the money with a few clicks of a mouse. 

The freshly minted cash now in the hands of financial institutions can be used to fund everyday operations, including trading and speculation in financial securities. As implied by the above graph, a sizable fraction of this cash has gone into stocks over the past decade or so.

It should be noted that the relationship works in reverse as well. When the Fed has halted QE operations over the past decade, stocks generally move sideways along with the value of the Fed's balance sheet assets. And, although you have to squint to see it, on the rare occasion that the Fed has attempted to unwind (read: sell) assets from its balance sheet (which has the effect of removing some of that magically printed money from the financial system), stock prices have fallen.

The only time this relationship did not hold was 2018-2019. Despite Fed efforts to curtail QE and even unwind balance sheet assets during this period, stock prices continued to rise. However, as indicated by Stephanie on the graph, this period also corresponds to a time of tax cuts and deregulation that was favorable for stocks. Stated differently, the bullish backdrop essentially overpowered the bearish forces of Fed actions on stock prices.

The relationship quickly got back on track in early 2020 when the Fed embarked on a gargantuan QE program in response to the onset of COVID-19. The Fed's balance sheet has more than doubled since then to over $8 trillion. The value of the SPX has commensurately doubled as well. 

Moving forward, the relationship between QE and stock prices has important policy implications. As inflationary pressures grow, the Fed may be tempted to curtail or perhaps even reverse its bond-buying practices. Although doing so would relieve inflationary pressures that the Fed itself helped to create, stopping or reversing QE is likely to put downward pressure on stock prices. Any policy that tanks the stock market promises to be politically distasteful.

Whatever the Fed and other central banks who have engaged in QE decide to do from here to address the inflation that they themselves brought about, you can bet that they are looking at the same chart we are...

no positions

Sunday, July 25, 2021

Better Balance

Miyagi: You remember lesson about balance?
Daniel LaRusso: Yeah.
Miyagi: Lesson not just karate only. Lesson for whole life. Whole life have balance...everything be better. Understand?

--The Karate Kid

As an investor, I used to bet on one macro scenario. Even if I reasoned that several outcomes were possible, I'd put all my chips on the one I thought most likely.

I've come to learn that isn't a good idea. My most likely scenario might not materialize. And even if it does, it might take much longer than expected. Meanwhile the underweighted scenarios dominate.

So now I spread it around. If I envision three possible scenarios, then I allocate capital more or less equally among those three. I might adjust them a bit based how I suspect things might unfold, but I retain material exposure to all of the possibilities.

Although I won't kill it if my preferred scenario happens to play out, my performance is more balanced.

I no longer worry about having to be exactly right in both direction and timing. And I sleep better.

Sunday, March 1, 2020

Less Trade, Higher Prices

We stand to lose all time
A thousand answers by 
In our hand
--Yes

To answer your question, Liz, yes. Two natural forces in particular have been keeping price increases at bay over the past couple of decades--despite escalating inflationary policies of central banks seeking to do otherwise. One has been the broad integration of several powerful innovations, particularly with respect to info tech, into production processes. Small computers, the internet, wireless, et al have dramatically improved worker productivity. As output/hr goes up, there is downward pressure on prices.

The second natural force has been expansion of global trade, which allows world economies to realize gains from specialized production. When division of labor increases, learning effects and lower switching costs boost productivity. When specialized producers exchange their output, those productivity gains are collectively shared. Those shared productivity gains exert downward pressure on prices.

Restraints on global trade, whether those restraints come from protectionist tariffs, bans to quell the spread of illness, or other sources, eliminate a big source of downward price pressure.

As such, a big wind in the face of aggressive central bankers seeking to 'create inflation' ceases to blow, and higher prices of goods and service become more likely.   

Sunday, February 23, 2020

Monetization and Prices

I never meant to be so bad to you
One thing I said that I would never do
--Asia

Suppose the Fed, thru its debt monetization activities, creates $1 million out of thin air to buy some bonds from one of its primary dealers, JP Morgan (JPM). The Fed lifts $1 million worth of Treasuries, agencies, et al from JPM's inventory in exchange for the newly minted cash.

Being a financial institution, JPM is likely to put the money to work thru lending or investing activities. Let's say that JPM uses the $1 million for proprietary trading in stocks. It might even lever up its trading capital to get extra bang for the buck.

Regardless of how it is used, the bulk of the $1 million remains in the financial system somewhere. Unlike credit money that exists only as long as the borrower has appetite for leverage, money created for monetization purposes persists unless/until the Fed reverses its initial transaction and sells its bonds on the market--at which time the Fed reclaims and retires the $1 million that it had previously printed.

As expected, the $1 million that JPM deploys causes prices to rise while it is in the market. But because JPM and other financial institutions are the early beneficiaries of the newly minted cash, it is primarily the prices of financial assets that rise. Stocks, bonds, real estate...whatever the banks buy with the $1 million go up in price. Importantly, as long as financial assets go higher in price, most of the $1 million dollars of newly created money remains locked in the financial system.

This is why we do not see broad consumer price increases from central bank monetization activities--at least initially. Financial assets prices can shoot toward the moon (as we have seen) while the prices of break and milk remain relatively stable.

If for some reason prices of financial assets begin to fall, then the balance might shift. Lower prices will drive investors to sell and pull money out of the financial system. When this occurs, the $1 million is released from the financial system begins to make its way into the every day economy.

This is when we'll see the price of goods and services rise in earnest.

The formal propositions are as follows:

Proposition 1a: When money is created for central bank monetization activities, the printed money will be used by financial institutions to buy financial assets, thus driving asset prices higher.

Proposition 1b: When prices of financial assets subsequently decline, the printed money rotate out of the financial system into the everyday economy, where it will be used by consumers to buy goods and services, thus driving consumer prices higher

no position

Sunday, February 9, 2020

Interest Rate Decline

It's been such a long time
I think I should be going
And time doesn't wait for me
It keeps on rolling
--Boston

Interesting graph of interest rates over many centuries courtesy of Visual Capitalist. Obviously, the trend over the past eight centuries has been down.


Several theories are proposed to explain long term interest rate decline. Productivity growth should influence interest rates. As productivity increases, scarcity declines. More capital should be available to borrow, thereby lowering borrowing costs.

The article takes a different view, however. Focusing on the continued decline in rates over the past 30-40 yrs, the author proposes that lower productivity leads to less business investment and therefore less demand for capital. The opposite should be true. Lower productivity means that capital will be more scarce. Less supply means higher prices, all things equal.

The author also proposes aging demographics and slowing economic growth as driving rates lower recently. Of course, this does little to explain the longer term down trend, as there were many periods over the past few centuries where populations grew dramatically and economies boomed.


It is also noted that bond yields have been falling coincident with declining rates--as if bond yields are supposed to trend independent of interest rates. Let's clear up the confusion. Interest rates constitute a price--the price associated with borrowing money. Bonds are a vehicle for borrowing money. Bond 'yield' coincides with the borrowing price. The real news would be if interest rates and bond yields were not highly correlated.

What the article completely ignores is the work of central banks over the past 100+ years to interfere with the natural rate of interest. Slowdown in productivity growth should have caused rates to level out or perhaps to rise. However, central bank intervention has continued to force rates lower, thereby keeping the eight century downtrend in place.

If central banks lose control of rates, then they will surely rise and jeopardize the long term downtrend.

Monday, December 23, 2019

Policy Uncertainty and Inflation Expectations

"Remember, sometimes when you're blind, and times seem darkest, you can often see more clearly."
--David Sloan (Kickboxer 2)

Article suggests a negative relationship between policy uncertainty and inflation expectations. The greater the policy uncertainty, the lower the expectations of inflation.


This is not necessarily intuitive. I suppose the argument goes like this. When people have trouble predicting what will happen in the institutional/regulatory environment, they will hoard cash and pull back on purchases (kind of like the 'wait and see' approach to investment advanced by researchers). Expectations of price increases therefore decline.

But we've seen the opposite as well, haven't we? In unstable policy environments, people can get nervous about holding onto cash because it might degrade in the future. Dumping cash on the market causes expectations of prices to explode higher. A reinforcing cycle commences where Big Inflation motivates even bigger inflation expectations.

The relationship between policy uncertainty and inflation expectations is moderated, it seems. What are those moderating variables?

Tuesday, November 26, 2019

Money Spigot

Rain on my face
It hasn't stopped
Raining for days
My world is a flood
Slowly I become
One with the mud
--Jars of Clay

Credit creation is inherently deflationary. Credit money supply increases upon the creation of debt but it contracts when debt is repaid or defaulted on.

In past cycles central banks have countered the deflationary phases with lower interest rates that spark even more credit creation. But each cycle requires lower rates than before, and marginal bang for the credit buck gradually declines.

With lower interest rates waning in their effectiveness and approaching the 'zero bound,' central banks are now turning toward monetization. This involves printing money out of thin air to buy stocks, bonds, and other financial assets to prop up prices in the face of deflationary decline. Why must central banks do this? Well, the system has become so levered up from past credit creation that even small declines in prices threatens to render balance sheets insolvent.


The next logical step involves simply printing money and sending it to people directly. This is the endgame. Flooding the entire economic system--not just the narrow financial system--with freshly minted cash.

This is how all currencies collapse. First excess borrowing and debt. And then opening the money spigot to keep the system solvent, which morphs into a hyper-inflationary endgame.

Saturday, October 19, 2019

Repo Madness

All our times have come
Here but now they're gone
--Blue Oyster Cult

As we've noted, the Fed has embarked on another monetization program. A primary focus of this intervention is the repo market, where short term financing rates have skyrocketed over the past few weeks, surpassing highs during last decade's credit market freeze.

We've written about repos before, and speculated that they could potentially lie at the epicenter of the next financial system meltdown (here, here, here).

The question, however, is why now? What is causing the repo market to crack at this moment?

The regulatory backdrop has been ripe for some time. Post-crises revisions to banking regulations have forced banks to set aside more than $1 trillion in reserves. Repo rates are rising in part not because of a scarcity of cash in the banking system, but because that cash cannot be used to fund repo loans. Regulations are also constraining the return creditors can realize on large lending positions in short term money markets.


The Fed's sell down of QE program assets has exacerbated the stress. Until the Fed (predictably) suspended its QE unwind a couple months back, it was draining tens of billion$ monthly from the system as it sold back the bonds that it had previously purchased during QE (with money created out of thin air, of course). Those sell backs took cash off the repo market, perhaps to a tipping point. Now, the Fed's recent monetization program is once again sending cash (created out of thin air) in exchange for bonds (as shown above).

Peter Schiff adds that ever more federal debt coupled with shorter maturities on that debt means that record levels of debt need to be financed daily. Banks have dutifully bought those bonds--as they in part are required to do by recapitalization laws put in place since 2008. Once again, this leaves less cash available to fund repos.

Perhaps it has just been the confluence of these factors that have cracked the repo market, although I can't help but think that something more acute is pushing this situation overboard. We'll likely know soon enough.

Also not hard to think back to the early days of the credit collapse. Early tremors (e.g., New Century Financial) before the dominos starting hitting each other in the mortgage markets. Is the repo market an early tremor this time around?

Thursday, October 17, 2019

Monetization, Pure and Simple

The deception, with tact
Just what are you trying to say?
--The Fixx

When it wants to employ 'monetary policy' to stimulate economic activity, the Federal Reserve can choose from three primary approaches. All three involve the creation money out of thin air (i.e., 'money printing'). However, the dynamics differ depending on the approach employed.

The most popular approach to date has been to lower the interest rate charged to banks that want to borrow funds from the Fed. All else equal, the lower the cost of borrowing money, the more money that will be borrowed. Presumably, banks would then use those borrowed funds to engage in lending, investing, and other activities that would stimulate the economy. The funds that the Fed lends are sourced out of thin air. The catch, however, is that this form of money, sometimes referred to as 'credit money,' is not free and clear. It is not like receiving a $100 bill as a gift. Instead, it is like taking out a $100 loan. The loan is a liability. You can spend the $100, but you must pay it back in the future--with interest at the rate specified by the Fed. As such, credit money created is subsequently 'destroyed' when the loan is paid back. Credit money can therefore be seen as temporary in nature. When credit contracts, so does the supply of credit money.

A second approach is to simply send checks directly to the people. This is the 'helicopter money' idea famously elaborated by former Fed chair Ben Bernanke. To date, the Fed has rarely used this approach, although central banks elsewhere have engaged in goodly amounts of helicopter money--often to the visible detriment of the monetary system (e.g., Weimar Germany, Zimbabwe, Venezuela). A recent example on a small scale here in the US was the 'tax rebate' checks sent to people in attempts to stimulate the economy during the 2008 credit collapse (a collapse which, by definition, destroyed lots of credit money discussed above). Imagine this on a larger scale, e.g., $50,000 checks sent to every US citizen every month, to get a sense of big league helicopter money.

The third approach, one that has gained recent popularity, is monetization. Monetization is where the Fed creates money out of thin air to buy assets. The Fed's three 'quantitative easing' programs (QE1, QE2, QE3) programs were large-scale monetization schemes. From 2008-2015, the Fed bought nearly $4 trillion of Treasury, agency, and other debt from bond dealers. The Fed put those assets on its balance sheet. In exchange, bond dealers got $4 trillion of freshly minted cash. How might this stimulate economic activity? The thought was that, in addition to the direct effect of putting money in bond dealers' pockets (which could be used for investment or consumption purposes), interest rates would also be pulled down by the bond buying (when bond prices go up, bond yields come down). Lower rates, as noted above, should stimulate borrowing all else equal.

Other central banks followed the Fed's lead and established their own flavors of QE-style monetization. Currently, the Bank of Japan and European Central Bank operate QE programs that dwarf the $4 trillion Fed project.

Last week, the Fed announced that, after a four year respite, it will once again buy assets. This time the focus will be on shorter duration Treasuries. The central bank adamantly denies that this is QE, but this is a semantic smokescreen.

Bond buying, whatever the duration and for whatever reason, is monetization, pure and simple.

Saturday, July 27, 2019

Since Yesterday

"Screw FDR, screw Hoover. They're all the same. I come home one day I'm standing in my living room, and between the mortgage and the market and the goddamn lawyer that was supposed to be working for me, it stopped being mine. It all stopped being mine. FDR hasn't given me my house back yet."
--Mike Wilson (Cinderella Man)

After the Fed's ill-conceived actions to achieve general price stability during the 1920s brought on the Great Depression, the correct response would have been to get out of the way and let prices fall to permit market excesses to clear.

Unfortunately that is not what occurred.


1934-S 50c PCGS MS66+ CAC

Many New Deal policies, initiated by the Hoover administration and then escalated by FDR, sought to maintain prices at artificially high levels. Wage rates, commodity prices, you name it. Programs came out of the woodwork to restrain market forces from taking prices where they needed to go: lower.

Paradoxically, many onlookers understood that these price stability policies were ill-conceived--even if these people were committed New Dealers. For example, Frederick Lewis Allen, a journalist who penned what in my view was an even-handed review of the 1920s, betrayed his neutrality with a sequel about the 1930s (Allen, 1939) that was clearly sympathetic toward the New Deal. Despite his bias, however, Allen did admit several times during the book that the interventionary policies did not seem to be working. Unusually high unemployment persisted. Private investment remained stubbornly low. Prosperity had not returned.


1937-S 50c PCGS MS66+ CAC

At one point, Allen explained the problem this way:

"Throughout the early years of the New Deal the levels of prices and wages and the structure of corporate and private debt were being artificially supported by government spending...If it had been possible for the law of supply and demand to work unhindered, prices and wages--and the volume of corporate and private debt--would theoretically have fallen to a 'natural' level and activity would have been resumed again. But it was not possible for the law of supply and demand to work unhindered. In a complex twentieth-century economy, deflation was too painful to be endured. Hoover had set up the RFC because banks couldn't take it; Roosevelt had set up the Federal relief systems because human beings couldn't take it." (223)


1939-S 50c PCGS MS67+ CAC

Near the end of his work, Allen pondered the economic malaise that endured into 1939:

"Must America at last be reconciled to the dictum that as its population growth slowed up it economic growth must slow up too? Must it accept either a continuance of this twilight prosperity, with the burden of carrying the unemployed becoming progressively greater, or else a grim deflation of prices and wages and debts till the labor surplus could be absorbed--a deflation which might be even less endurable than that of 1929-33? No one could relish either of those prospects." (334)

Allen and others knew what was needed. But they couldn't take the pain associated with letting markets clear.

That same pain avoidance policy--euphemistically labelled  price stability--endures Since Yesterday.

Reference

Allen, F.L. (1939). Since yesterday. New York: Harper & Row.

Friday, July 26, 2019

Who Likes High Prices?

Hundred dollar car note
Two hundred rent
I get a check on Friday
But it's already spent
--Huey Lewis and the News

Phillips et al. (1937) convincingly argue that the Federal Reserve was seeking to stabilize general prices at an artificially high level during the 1920s. But who was the central bank trying to placate with this policy? As of yet, the Fed had no formal 'price stability' objective.

The everyday consumer certainly does not clamor for higher prices. Always and everywhere, the average person welcomes lower, not higher, prices in order to extend purchasing power and standard of living. And that is what should occur in unhampered markets as improved productivity thru capital investment puts downward pressure on prices.

Who, then, benefits from prices being propped up? Several groups come to mind.

Inefficient and uncompetitive businesses. It is easier to manage operations when selling prices are high. Environments that exert downward pressure on prices require more capacity for innovation and efficiency. When prices are artificially kept high, less entrepreneurial energy is required.

Leveraged entities. Entities carrying lots of leverage dread lower prices. If you've borrowed money to buy or produce balance sheet assets, then declining price environments threaten your solvency. The value of assets declines while debt values remain constant. Equity gets thinner and, if prices decline enough, you're upside down and busted. Banks are classic examples here. In the 1920s, farmers constituted another large group with a powerful lobby.

Bond sellers. Governments and businesses that want to sell debt can sell to non-economic buyers when central banks are in the market buying via their 'open market operations.' Bond sellers can sell their paper at higher prices and at lower coupons than they otherwise could.

The Fed itself. Legitimacy increases for a central bank that it can manipulate market prices. Moreover, central planners that possess the control gene may not be able to restrain themselves from meddling in monetary affairs.

It is likely that various institutional forces were influencing Federal Reserve actions to prop up prices during the 1920s. Those pressures remain with us today.

Saturday, July 20, 2019

Banking and the Business Cycle

"Never had my house pushed over before. Never had my family stuck out on the road. Never had to lose everything I had in life."
--Ma Joad (The Grapes of Wrath)

Ten years ago I began a book about the causes of the Great Depression called Banking and the Business Cycle (Phillips, McManus & Nelson, 1937). With my renewed reading campaign about the 1920s and 1930s this summer, I recently finished this insightful work.

The backdrop is compelling for several reasons. The authors are three professors who conduct their analysis with requisite academic rigor. Footnotes and data abound. The analysis focuses on monetary-related causes of depression. Findings are integrated to formulate a general theory of business cycles that goes beyond the Depressionary period. Finally, the book was written while the Depression was still at work. Similar to the recently completed Allen (1931) work, publication inside the period adds freshness and validity that later work can't replicate.

Their analysis points directly at that policies of the Federal Reserve--policies enacted during WWI and in the following decade--as causing the depth and length of economic malaise that characterized the Depression. The Federal Reserve Act was passed in 1913, a couple of years before WWI began. Relaxed parameters of the newly created central banking system (e.g., lower reserve ratios, member banks needed to deposit all reserves with Federal banks, low Federal Reserve bank reserve ratios, lower reserves required for time deposits) expanded credit creation capacity orders of magnitude greater than what was possible pre-Fed. This enabled US WWI operations to be funded primarily through the sale of government bonds that were purchased primarily by the banks. As is usually the case when war is funded by inflationary policies, prices generally increased during this period

Following the war, market forces naturally worked to correct the systemic distortions. A general deflation commenced to destroy excess credit and decrease prices. (The authors present interesting data indicating that during the two prior US wars--the war of 1812 and the Civil War), prices generally returned all the way to their pre-war levels and then some). Much of this deflation occurred during the deep but relatively brief Depression of 1920-1921.

Coming out of that depression, however, prices had only retraced about 50% of their wartime increase. This is when the Fed began a multi-year campaign to intervene in the name of 'price stability.' In 1922 the Federal Reserve embarked on the first of three rounds (they did similar in 1924 and 1927) of lowering what today we call the 'Fed Funds rate' and engaging in 'open market operations' (read: bond buying) that, coupled with the central banking system's newfound capacity for pyramiding credit through the system, created the leveraged fuel that funded several rounds of speculative investment--first in productive capacity, then in real estate, and finally in stocks--that inflated the bubble that ultimately popped with the market crash of 1929.

It is interesting to note that prices of goods and services did indeed stabilize. Despite all of the credit creation, prices of consumer goods did not change much and never reclaimed pre-WWI levels. However, prices of speculative assets such as real estate and stocks went through the roof. Although the authors did not call it such, they explain this phenomenon as if it were the Cantillon Effect. The newly created credit largely remained within the financial system, and the first users of the newly created credit bid up the prices of financial assets accordingly.

Those who cannot recognize the parallels to our present situation are not engaging their brains.

Post crash, the authors considered why economic activity persisted at such depressed levels. Their explanation centered on New Deal policies, many initiated during the Hoover administration, that extended the previous decade's price stability motive via additional rounds of monetary and fiscal policy. They make a particularly compelling argument that restricting layoffs and legislating minimum wage rates essentially institutionalized widespread unemployment. Letting labor markets clear at much lower wage rates, in authors' view, was the quickest way to end the Depression.

I was longing for a deeper dive into the effects on savings during the period. What happened to savings rates during the 1920s? And if savings were sharply lowered during the boom, then how could the economy expand significantly until those savings had been replenished? A rigorous discussion of the interaction between credit creation and real savings would have been icing on the cake.

That said, this is a superior analysis with few peers. An amazing work from individuals who were still living the times.

Reference

Phillips, C.A., McManus, C.F. & Nelson, R.W. (1937). Banking and the business cycle. New York: The Macmillan Company.

Thursday, July 11, 2019

Late to the Avalanche

Oh it's too easy to live in a cold sweat
Just sitting dripping in pools below
You can wipe your face
Kill the pain
But the fever won't go, no, no
--Genesis

Right on cue from our earlier post, it seems the Pomboy girl is also experiencing some deja vu back to 2007. Back then, while the Fed was cutting rates at stock market highs, the central bank's actions were not preemptive in the least. Instead, the Fed was unable to get ahead of the subsequent avalanche of widening credit spreads.
Now, we have record debt, much of it low (read: junk) quality, getting ready to roll in record quantities.

Is the Fed once again late to the avalanche, as Steph suggests?

Rate Cuts at Market Highs

'Cause she's so high
High above me
She's so lovely
--Tal Bachman

Major US equity indexes are marking all time highs after Fed chair Jerome Powell's dovish speech in front of Congress yesterday seemed to guarantee that the FOMC will cut rates at its upcoming July meeting. That the Fed plans to lower interest rates with markets at all time highs has raised more than a few eyebrows.

But such a move is not unprecedented. In the fall of 2007 the Fed cut rates three times to bring down the Fed Funds Rate a full percent from 5.25% to to 4.25%. Stock markets proceeded to rally to all time highs during this period.


The euphoria was short-lived, of course. The following year saw markets absorbing the full effects of the credit crisis. The SPX would fall more than 50% from those rate cut highs. In fact, the Fed furiously cut rates in 2008, lowering the Fed Funds all the way down to an astonishing 0.25% by December.

By that time, markets  no longer celebrated the cuts. Instead, they plummeted lower.

History suggests that caution, not euphoria, is sometimes warranted when the Fed cuts rates at all time stock market highs.

Monday, June 10, 2019

Hotel California Monetary Policy

Relax, said the nightman
We are programmed to receive
You can check out any time you like
But you can never leave
--The Eagles

Early in his recent CNBC interview, Stan Druckenmiller confesses (at around the 7:40 mark), "I don't understand the Fed's monetary framework at all." He goes on to say that he grew up in an era where the Fed used monetary policy to 'lean against' extreme highs and lows in economic cycles, and that Fed policymakers under Janet Yellen missed their opportunity a few years back to return the Fed Fund Rate back more 'neutral' levels during periods of economic strength.


However, evidence suggests the Fed has rarely behaved as Druck suggests--at least for the past three decades. As indicated in the above graph of historical Fed Funds Rates (source here), the Fed never returns rates to levels that match previous cycles. New high water marks in Fed rates are always lower than previous iterations. Consequently, rates have been stair-stepping lower since their peak in the early 1980s.

With the Fed's recent walk back in its tightening policy, the central bank is signaling that it will once again repeat the pattern. The current Fed Funds Rate of almost 2.5% will almost surely mark another lower high in the series.

What drives the Fed to be secularly dovish in its monetary policy? One reason is that the Fed is a political animal. It succumbs to institutional pressures to keep money and credit flowing easily. Fed bureaucrats do not want to be seen as the party poopers that take the punch bowl away. They would surely face political, economic, and social consequences for doing so.

Another explanation is that the Fed simply realizes that it can't return rates to previous levels without imploding the financial system. Each time the Fed forces interest rates lower than true market rates, more credit is created than unhampered markets would deem prudent. Consequently, each cycle of Fed easing results in more debt and leverage than the previous one.

An axiomatic principle of leverage is this: the greater the leverage in the system, the more sensitive the system becomese to any uptick in interest rates. Higher rates increase debt servicing rates. Moreover, higher rates reduce demand (and thus prices) for assets purchased on margin. For leveraged asset owners this is bad news from a balance sheet perspective. Asset values are declining while liabilities remain constant, thereby increasing the likelihood of insolvency.

The Fed knows by lowering interest rates, it creates a more leveraged financial system. If it were to subsequently raise rates back to previous levels, the Fed also knows that it runs the risk locking the system up in the throes of a deflationary spiral.

The Fed's monetary framework that Stan Druckenmiller claims to not understand can be seen as resting on a Hotel California-like paradox. Although it is headed toward a bad destination, Fed interest rate policy can't be reversed without untenable consequences--at least in the eyes of bureacrats.

Sunday, March 24, 2019

Why the Fed Caves

"Well, we're now so levered up that once it gets outside these limits, it gets ugly in a hurry."
--Will Emerson (Margin Call)

Chart below shows the Fed Funds target since 1992. The low periods correspond to recessions (~1992, 2002, 2008). Note the lower lows and lower highs--the technical definition of a downtrend.


This helps portray the Fed's predicament. Each time we have a recession, the Fed lowers rates below market, prompting more borrowing than would otherwise occur. In natural market cycles not subject to central bank intervention, just the opposite should occur. Debt should fall during a recession as bad loans get extinguished, interest rates rise, and saving commences.

In unnatural market cycles, with Fed policies that force rates lower, we get more debt and leverage. And, by definition, less savings.

This leaves the system weaker coming out of downturns rather than stronger. Thanks to central bank policies, the system always exits a recession more levered up than before.

Thus, attempts by central banks to 'normalize' rates back to levels of previous expansions are destined to fail. Why? Because the greater the leverage in the system, the less tolerant the system is to rising interest rates and falling asset prices used as collateral against the debt.

Stated differently, the collective balance sheet, being more leveraged, is more susceptible to insolvency should rates rise and asset prices fall.

This is why the Fed always caves and turns dovish earlier in the present cycle compared to the previous cycle. With each passing cycle, the Fed paints itself (and the economy) farther into a corner that it cannot escape.

Tuesday, February 12, 2019

Credit vs Cash Money

The world's a nicer place in my beautiful balloon
It wears a nicer face in my beautiful balloon
--5th Dimension

There are two types of fiat money. Credit money is created when a bank or similar entity loans funds. It 'mints' money for the debtor, but the money is not free and clear. The loan must be paid back. Thus, the inflation caused by the credit money's creation reverses to a deflationary event when the loan is retired (or defaulted on). Credit money is ultimately deflationary.

Cash money is created by a government agency (e.g., Treasury) or associated authority (e.g., Fed) that produces cash money in either physical form using a printing press or using a mouse click in electronic account. Because money created in this manner is not linked to a liability, it is far more durable and more difficult to extract from the system. Cash money is ultimately inflationary.

Tuesday, December 4, 2018

Macro Movement

We thought just for an instant
We could see the future
We thought for once we knew
What really was important
--Til Tuesday

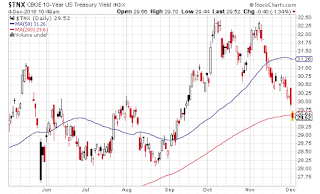
Big rally in long bonds. Ten year yields have broken below 3% and are flirting with the 200 day moving avg.


Might be a sign that investors think the Fed will indeed reverse interest rate policy sooner rather than later. Or perhaps it's a 'flight to quality' as investors seek to reduce risk and pile into Treasuries.

With gold showing signs of life as well, 'macro' indicators beyond stocks are beginning to stir. Precisely why remains to be seen.

position in gold

Monday, October 15, 2018

Everything Bubble

"It's clear as a bell to those who pay attention. The mother of all evil is speculation--leveraged debt. Bottom line: it's borrowing to the hilt. And I hate to tell you this, but it's a bankrupt business model. It won't work. It's systemic, malignant...and it's global."
--Gordon Gekko (Wall Street: Money Never Sleeps)

Ten years after the credit market meltdown, Ron Paul observes that we are not better off economically. In fact, we are worse off.

Huh? With all the positive economic headlines popping up daily, and stock markets just a couple of percent off all time highs, how can we be worse off?

The problem is leverage and debt--leverage and debt that are multiples higher than the leverage and debt of 10 years ago that nearly took down the financial system.

Today's leverage and debt were spawned by the most aggressive central bank monetary policies in the history of the world--as well as by government policies of bailing out all nearly all institutions that, thru their reckless borrowing and lending practices, nearly tanked the system last time.

Whereas during the last cycle easy money and credit poured into the real estate market, this time around easy money and credit has poured into everything. Credit cards, student loans, cars, housing (again), stocks, and, of course, government. As RP notes, "Federal debt is over 21 trillion dollars and expanding at tens of thousands of dollars per second."

What we have is an Everything Bubble. The crisis potential of this Everything Bubble, when it pops, promises to dwarf the meltdown of 10 years ago. The more accurate comp will likely be the Great Depression.