Holding hands while the walls come tumbling down
When they do, I'll be right behind you
--Tears for Fears
The 'final' revision' of Q1 GDP found that the US economy contracted at a 2.9% annual rate. In other words, output shrank. Back in January, 'consensus' estimates were for a gain of 2.6%. The government, just like corporations, blame the miss on 'weather.'
While the large near term drop in output is disturbing, the bigger picture problem is secular decline in US GDP growth.
The graph below plots annual percentage change in GDP using quarterly real GDP since 1947. It is clear that GDP growth has been slowing for decades.
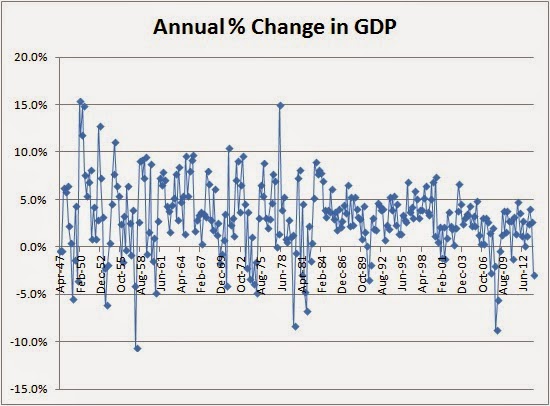
From 1950-1969, GDP growth averaged 4.2%. From 1970-1999 growth slowed to 3.2% (two sample t-test for difference in means p = .084). Since 2000, mean GDP growth has slipped to 1.7% (p = .003).
Because 'real' GDP over-reports output because it under-reports CPI-based inflation, actual decline in GDP growth is likely much worse.
Why is GDP growth slowing or perhaps contracting? Markets are becoming less free, and savings--the basis for investment and productivity improvement--is evaporating in favor of debt.
Because output and prosperity go hand in hand, we're tracing a decline of prosperity.
![[Most Recent Quotes from www.kitco.com]](http://www.kitconet.com/charts/metals/gold/t24_au_en_usoz_2.gif)


1 comment:
Median household income had declined over the past decade while GDP per capita had gone up.
One of the reasons that most people may perceive themselves as being worse-off even though average GDP is increasing is because they are indeed worse-off.
~Joseph Stiglitz
Post a Comment